Setting up standalone Prometheus with Grafana in Ubuntu Local

Here are the items needed to run prometheus and export data to grafana
- Prometheus
- Node Exporter
- Graphana
1. Download and Extract Prometheus
Run following commands
wget https://github.com/prometheus/prometheus/releases/download/v2.54.0/prometheus-2.54.0.linux-amd64.tar.gz
tar -zvxf prometheus-2.54.0.linux-amd64.tar.gz
2. Download and Extract Node Exporter
wget https://github.com/prometheus/node_exporter/releases/download/v1.8.2/node_exporter-1.8.2.linux-amd64.tar.gz
tar -zvxf node_exporter-1.8.2.linux-amd64.tar.gz
3. Download Grafana OSS edition
wget https://dl.grafana.com/oss/release/grafana-11.1.4.linux-amd64.tar.gz
tar -zxvf grafana-11.1.4.linux-amd64.tar.gz
Running Node Exporter
Go to Node Exporter folder. Open terminal and run command

It will be running at http://localhost:9100. Verify by click link on the left
Setting up Prometheus to work with Node Exporter and Grafana
- Open prometheus.yml inside prometheus folder and replace content with lines below
global:
  scrape_interval: 5s

scrape_configs:
  - job_name: 'node'
    static_configs:
      - targets: ['localhost:9100']

remote_write:
- url: http://localhost:3000
  basic_auth:
    username: admin
    password: admin
Explanation of above lines
- Node exporter is running at localhost:9100
- Remote write corresponds to the upcoming Grafana server which will be running at localhost:3000. default username and password is both “admin”
Now lets start Grafana
- Goto grafana/bin folder and Open terminal to run command
./grafana serverNow lets start Prometheus
- Goto Prometheus folder and Open terminal to run command
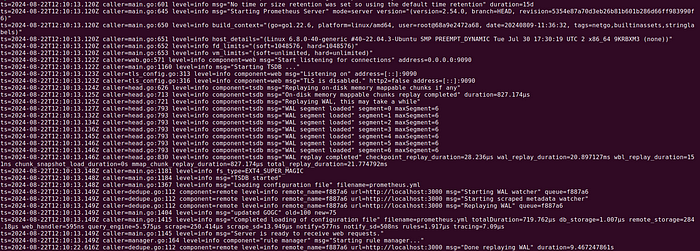
./prometheus --config.file=prometheus.ymlAnd it will start like this
Now open web browser and goto http://localhost:3000/login

For both username and password enter admin
Now it will ask you to change default password

Give new password and confirm it and click on Submit
Creating item on dashboard
Post login you will be redirected to the dashboard

Click on Create new Dashboard

Click on Add Visualization button

Click on Configure a new data source

Click on Prometheus and under url give http://localhost:9090

Scroll down and click Save & test button

Now goto Dashboard -> Add Visualization -> Prometheus
In PromQL section, add query
rate(http_requests_total[1m]) * 10